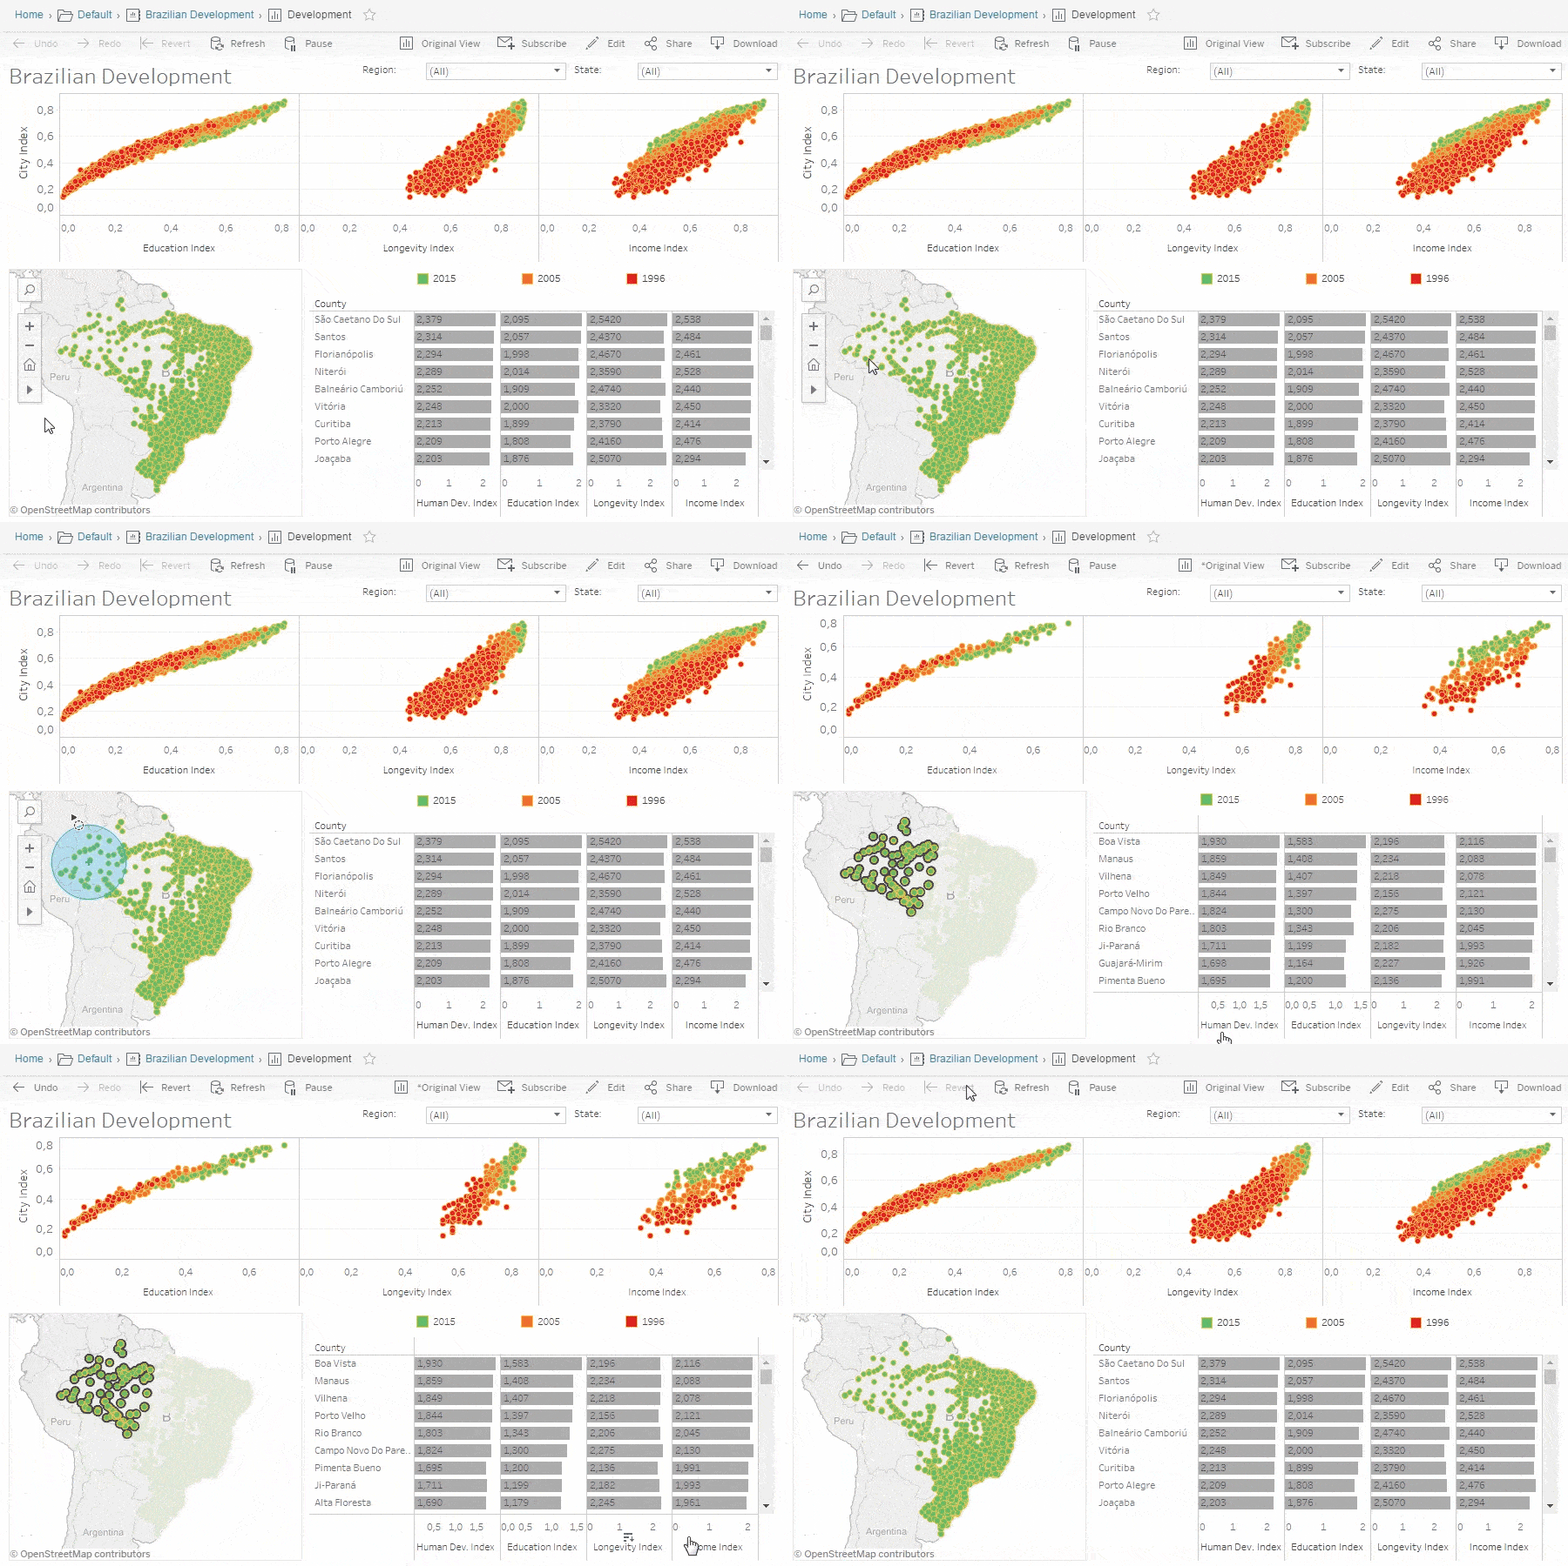
I began to fall in love with a Python Visualization library called Altair, and i use it with every small data science project that ive done.
Now, in terms of Industry use cases, Does it make sense to visualize Big Data or should we just take a random sample?
Data visualization is the graphical representation of information and data. By using visual elements like charts, graphs, and maps, data visualization tools provide an accessible way to see and understand trends, outliers, and patterns in data.
In the world of Big Data, data visualization tools and technologies are essential to analyze massive amounts of information and make data-driven decisions.
 Our eyes are drawn to colors and patterns. We can quickly identify red from blue, square from circle. Our culture is visual, including everything from art and advertisements to TV and movies. Data visualization is another form of visual art that grabs our interest and keeps our eyes on the message. When we see a chart, we quickly see trends and outliers. If we can see something, we internalize it quickly. It’s storytelling with a purpose. If you’ve ever stared at a massive spreadsheet of data and couldn’t see a trend, you know how much more effective a visualization can be.
As the “age of Big Data” kicks into high-gear, visualization is an increasingly key tool to make sense of the trillions of rows of data generated every day. Data visualization helps to tell stories by curating data into a form easier to understand, highlighting the trends and outliers. A good visualization tells a story, removing the noise from data and highlighting the useful information. However, it’s not simply as easy as just dressing up a graph to make it look better or slapping on the “info” part of an infographic. Effective data visualization is a delicate balancing act between form and function. The plainest graph could be too boring to catch any notice or it make tell a powerful point; the most stunning visualization could utterly fail at conveying the right message or it could speak volumes. The data and the visuals need to work together, and there’s an art to combining great analysis with great storytelling.