
# Real-time-price-discovery-volume-management-at-e-marketplaces
The Agricultural market cannot just be explained by the simple principle of supply and demand. Rather, it is an interplay of many variables that ideally should be used in the price-discovery of crops. Post-harvest, farmers generally rely on the local prices set at mandis/marketplaces to sell their crops. It has been witnessed that using historical and real-time data, machine learning models could be built to predict real-time prices and also help manage crop volume.
1.1 The Aim:
Our aim is to build a real-time price discovery and volume management at e-marketplaces in the Agriculture sector in the state of Telangana. We present you with a dataset on agriculture around Telangana from the year 2016 to 2020 along with an additional record of the year 2021’s until the month of February and the key objective is to understand the forecasting trend in APMC (Agricultural produce market committee)/mandi price (Minimum, Maximum and Modal) & quantity arrival data for different commodities in Telangana.
2.1 Business Problem:
Post-harvest, farmers generally rely on the local prices set at mandis/marketplaces to sell their crops.
(i) Business Objective
Maximize profits for the cultivator and help them volume management of the crops.
(ii) Business Constraints
To minimize the problems in increasing crop productivity by alerting the cultivators about the predicted production amount.
3.1 Variable description:

Date: The time series data of arrivals of collected crops ;
Amc_Name: The Market Names all over Telangana ;
Crop: The crop name ;
Maximum: sum of Maximum price of arrived crops on the respective dates ;
Minimum: sum of Minimum price of arrived crops on the respective dates ;
Modal: Average price of arrived crops on the respective dates ;
4.1 Data Collection:
Data related to Market prices collected from the Telangana Govt website for the crops – Groundnut, Bengal gram and Maize.
Link Courtesy: http://tsmarketing.in/AMCwiseStaffParticulars.aspx
5.1 The Database:
We have made a connection to MySQL Database in Python such that it can capture the data stored in the database.
The steps included were as follows:
a) Install MySQL connector module
b) Use the pip command to install MySQL connector Python.
c) pip install mysql-connector-python
d) Import MySQL connector module
e) Import using an import mysql.connector statement so you can use this module’s methods to communicate with the MySQL database.
f) Use the connect() method of the MySQL Connector class with the required arguments to connect MySQL. It would return a MySQLConnection object if the connection established successfully, Use the cursor() method, Use the cursor() method of a MySQLConnection object to create a cursor object to perform various SQL operations. Use the execute() method,
The execute() methods run the SQL query and return the result.Extract result using fetchall(), Use cursor.fetchall() or fetchone() or fetchmany() to read query result. Close cursor and connection objects, use cursor.clsoe() and connection.clsoe() method to close open connections after your work completes
6.1. Data Understanding
The data comprised of the following columns:
a) Date
b) AMC – Agricultural Market Name
c) Crop
d) Volume (in Quintals)
e) Maximum Price
f) Minimum Price
g) Model Price
7.1 Insights gained from the data:
(a) The data was available from 2012 to 2021. As 2012 to 2015 there were very few entries and entries were not available for all markets, data from 2016 to 2020 was considered.
(b) There are a total of 75 Market Names available as below:
Mahbubnagar , Wanaparthy Town , Warangal , Narsampet , Siddipet , Makthal , Narayanpet, Suryapet , Jammikunta , Atmakur , Gollapalli , Jogipet , Siddipeta , Bhongir , Gadwal , Badepally , Choppadandi , Jangoan , Karimnagar , Mahabubabad , Gajwel , Kesamudram , Kollapur , Nagarkurnool , Thirumalagiri , Nizamabad , Achampet , Pargi , Shadnagar , Khammam , Jagtial , Sadasivpet , Zaheerabad , Vikarabad , Gangadhara , Kamareddy , Kalwakurthy , Tandur , Pitlam , Bicknoor , Ghanpur , Bowenpally , Mallapur , Husnabad , Medipally , Nekkonda , Ibrahimpatnam(JGL) , Marpally , Sardarnagar , Navabpet , Dharur , Gandhari , Wanaparthy Road , Devarakadra , Bhainsa , Pebbair , Vatpally , Korutla , Kulkacherla , Narayankhed , Sarangapur , Nirmal , Khanapur , Adilabad , Bhainsaa , Armoor, Alampur , Shankerpally , Bodhan , Kubeer , Dharmaram , Birkur , Metpally , Dharmapuri , Vantimamidi
8.1 A total of 6 crop types are available in the above markets for Bengal Gram, Maize and Groundnut as mentioned below:
(i) 'Groundnut pods-Common'
(ii)'Maize-Common'
(iii)'Bengal Gram-Common',
(iv)'Maize-Hybrid Old'
(v) 'Maize-Hybrid New'
(vi)'Groundnut pods-Wet'
View of the dataset in Tabular form:

9.1 Data Pre-Processing:
(i) NA Values
The dataset was checked for any NA values. There were totally of 28 rows with NA values. As the total number of rows was around 20000, it was decided to remove the rows with NA values as it would not impact the model building.
(ii) Outliers Treatment
Box plots were plotted for the Minimum, Maximum and Model values.
Outliers were detected in the box plot. There were totally of 15 outliers. On analyzing it was observed that these were due to incorrect data entry. So, they were removed from the dataset.
10.1 Exploratory Data Analysis:
Under EDA we worked on the following things:
(i)-Extracting important variables and leaving behind useless variables
(ii)-Identifying outliers, missing values, or human error
(iii)-Understanding the relationship(s), or lack of, between variables
(iv)-Ultimately, maximizing your insights of a dataset and minimizing potential error that may occur
later in the process.
-->These helped us in turning an almost useable dataset into a completely useable dataset. And later it helped us in analyzing relationships between variables
The inferences were drawn both descriptively and graphically using a dataset named as "Agriculture.csv".It is an extensive version of the dataset used for Model Building.
The Agriculture.csv dataset:

A few graphical EDA performed on the dataset:

11.1 Data Partitioning
As the dataset was huge, we decided to partition the dataset into 3 – train, validation and test. 2016-2018 data was considered as train data. 2019 as validation data and 2020 as test data.
12.1 Model Building
As the business objective is to perform a real-time price discovery, it was decided to build an LSTM model as it would keep into account the previous historical data as well while predicting.
The date column would not be needed in this case, so it was ignored.
The Crop and AMC columns were categorical data so Label Encoding was done for these 2 columns to convert them into numerical data. After that, these 2 columns of data along with the Minimum and Maximum values were used as the input features for the LSTM model with the Model value as the target variable.
The model was built with 2 LSTM hidden layers – one with 20 neurons and the next with 15 neurons.
13.1 Accuracy of the model
The built model showed an accuracy of 97% on the train data and 93% on validation data.
Train data graph:

Validation Data Graph:

When the model was run on the test data which is data of 2020, it showed an accuracy of 96%.
Test Data graph:

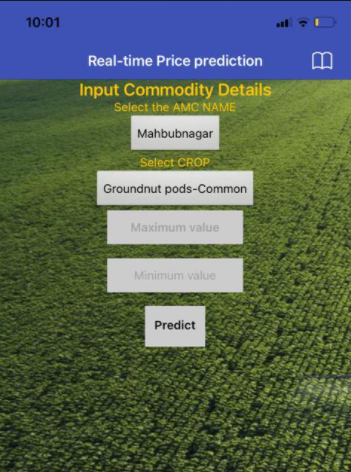
14.1 The Android Application:
Working Interface: The user has to choose the "AMC Name" and "Crop" in the drop-down menus along with giving the maximum and minimum prices as an input in order to predict the price. This will help the harvesters to track the predicted amount market-wise and commodity wise. This app was built using a web application integrated development environment originally provided by Google called "MIT App Inventor".
The view of the application:
15.1 The Interactive Dashboard
There are six different dashboards created using Tableau with the below content:
(i)Forecasting visualization on minimum, maximum and modal price of different crops with their production volumes in quintals.

(ii)Exploratory data analysis on different features with respect to the Date
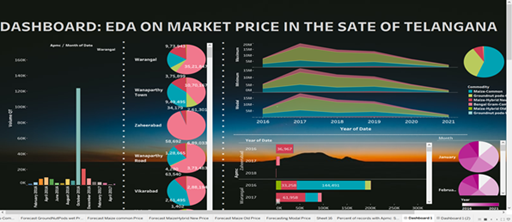
(iii)A Map View of Telangana state with its crop production and its volume in Quintals

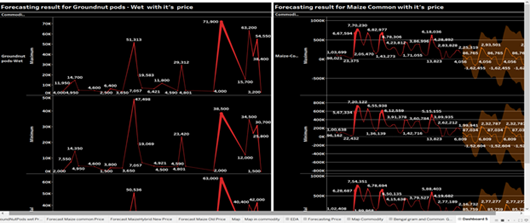
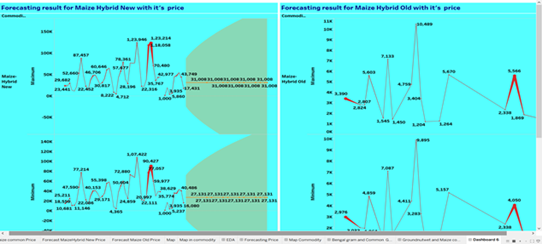
(iv)Forecasting of all varieties of crops with the maximum, minimum and Modal price
a) Bengal Gram Common and Groundnut pods Common

b) Forecasting of Groundnut pods wet and Maize Common with their prices
c) Forecasting of Maize Hybrid New and Maize Hybrid Old
on 05-04-2021 | "Voting Start & End Date "Apr 12, 2021, 9:00 AMApr 25, 2021, 11:59 PM (Asia/Calcutta)


