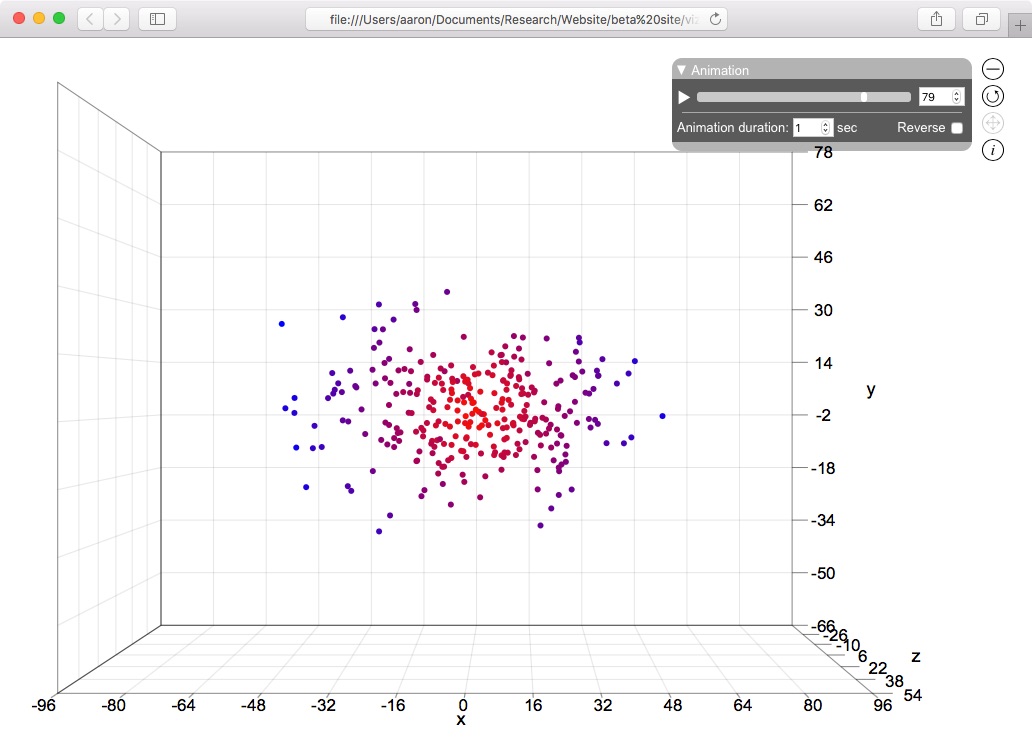
I have a set of values, w, for each (x,y,z). I want to visualize this 4D data as an interactive 3D image plot.
That is, each 3D pixel x,y,z should get some color based on w.
PS: w ranges from 0-7, and the rest of the (x,yz) are just transparent.
library(rgl)
set.seed(1)
x <- seq(1,10)
y <- seq(1,10)
w <- runif(100)
z <- runif(100)
wcolors <- rainbow(length(w))[rank(w)]
zmat <- matrix(z, length(x),length(y))
persp3d(x=x, y=y, z=zmat, col = wcolors)
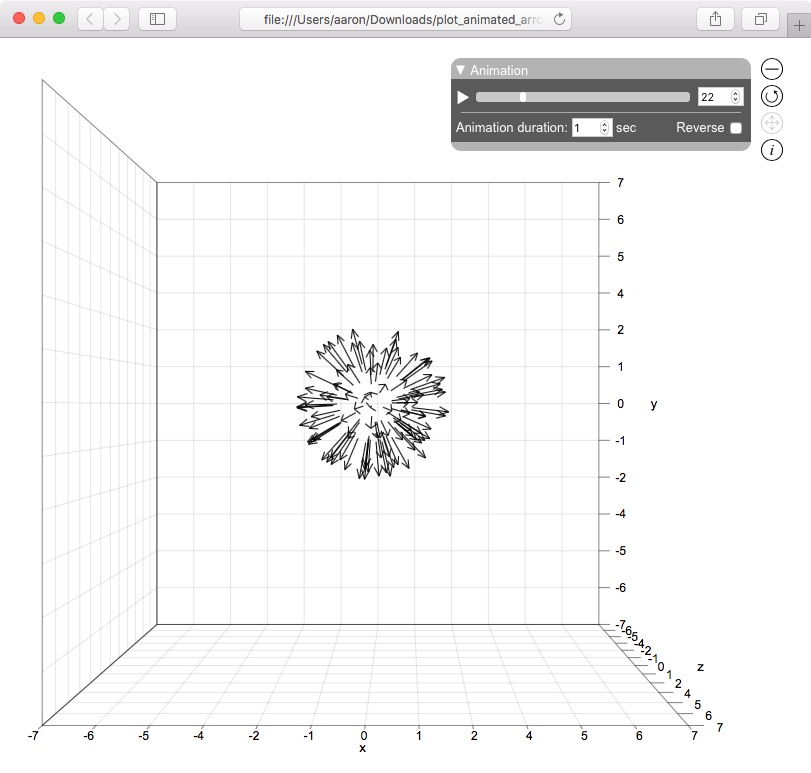
I use rgl for 3D visualization. You can rotate the image in rgl window using your mouse. Wheel zooms in/out.
example(plot3d)
rgl.bg(color = "black") # Space, the final Frontier.


