

Look for example here: https://www.kaggle.com/andyxie/tableau-sharing-best-practice/
I have published a Tableau 9.3 viz on Tableau public: https://public.tableau.com/profile/michel.page#!/vizhome/exercice1/Courbesventesetprofit
I have succedded to have this viz displayed in a web page by integrating the code given by the 'Share' button on the Tableau public viz page.
Now I want to do the same, but inside an IPython notebook. It seems to be possible because I saw an example in nbviewer here: http://nbviewer.jupyter.org/gist/msund/96bd1d837f4139b2558d
I have integrated the 'Share' button script code into a Markdown cell but the viz won't get displayed when the cell is run. When I look at the browser console, it seems that the js code, and object tag get sanitized, even if I tell IPython to trust the notebook.
Is there any workaround ?
Compared with R and Python, Tableau is a much faster way for data visualization. The best practice I can come up with is to set size to automatic when you create in tableau, share it on Tableau Public, and put the embed code like the following after you publish.
%%HTML
<Embed Code Here>
Look for example here: https://www.kaggle.com/andyxie/tableau-sharing-best-practice/
Basically what you need to do is this
step 1) copy the java script tag from Tableau workbook

step 2) Go and add the code in your jupyter cell code as below

Tableau a great visualisation and storey telling tool. It makes life so much more easier for data scientists and data analysts when they need stunning visuals to communicate their findings.
If you are a data scientist and you are presenting to a technical audience you might prefer to present using your Jupyter notebook where you and provide some live demo of your code. If this is the case, there is no reason why your audience should be left out from the stunning visuals. Is there a way you can merge Tableau visualisation into a Jupyter Notebook ? Yes, and interestingly, even though Tableau still does not work from Linux/Ubuntu, this method will work even from a Linux box.
To do this you need to first create your Tableau workbook in Windows or Mac. Then publish your workbook on the Tableau Public Server from the menu options as shown in the picture.
Once you client the share button, you can find the text box named Embed Code. Now, copy the text inside Embed Code.
Go to your Jupyter notebook where you want the Tableau dashboard to be displayed.
Enter into an empty code cell. Write %%HTML and then paste the copied text from Tableau public.
 https://datawisesite.files.wordpress.com/2017/06/screenshot-from-2017-06-26-14-05-50.png?w=150 150w, https://datawisesite.files.wordpress.com/2017/06/screenshot-from-2017-06-26-14-05-50.png?w=300 300w, https://datawisesite.files.wordpress.com/2017/06/screenshot-from-2017-06-26-14-05-50.png?w=768 768w, https://datawisesite.files.wordpress.com/2017/06/screenshot-from-2017-06-26-14-05-50.png 1006w" alt="Screenshot from 2017-06-26 14-05-50.png" data-attachment-id="138" data-permalink="https://datawisesite.wordpress.com/2017/06/26/how-to-embed-tableau-in-jupyter-notebook/screenshot-from-2017-06-26-14-05-50/" data-orig-file="https://datawisesite.files.wordpress.com/2017/06/screenshot-from-2017-06-26-14-05-50.png" data-orig-size="1006,129" data-comments-opened="1" data-image-meta="{"aperture":"0","credit":"","camera":"","caption":"","created_timestamp":"0","copyright":"","focal_length":"0","iso":"0","shutter_speed":"0","title":"","orientation":"0"}" data-image-title="Screenshot from 2017-06-26 14-05-50" data-image-description="" data-image-caption="" data-medium-file="https://datawisesite.files.wordpress.com/2017/06/screenshot-from-2017-06-26-14-05-50.png?w=300" data-large-file="https://datawisesite.files.wordpress.com/2017/06/screenshot-from-2017-06-26-14-05-50.png?w=636">
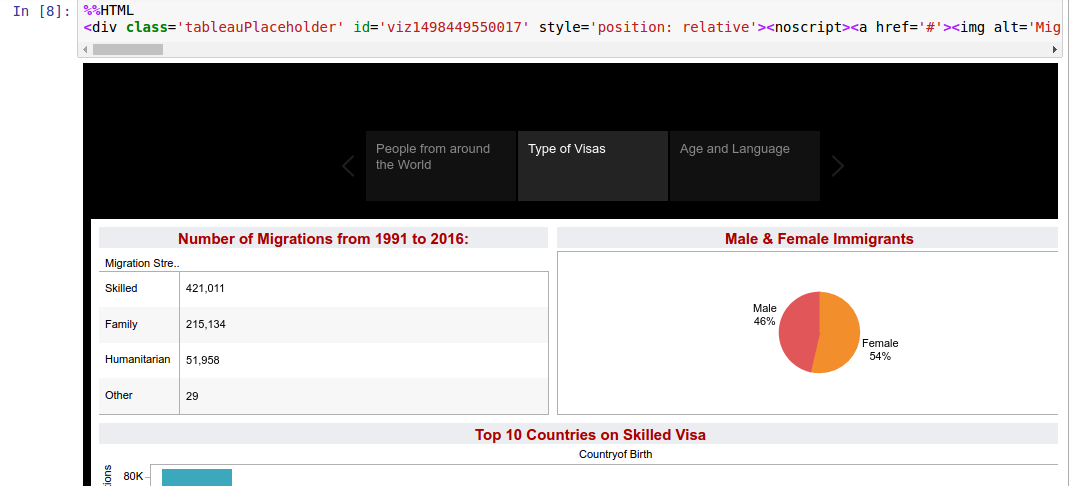
Execute the cell. And…………. you are done. Now the Tableau dashboard is visible from you Jupyter notebook.
 https://datawisesite.files.wordpress.com/2017/06/screenshot-from-2017-06-26-14-09-11.png?w=150 150w, https://datawisesite.files.wordpress.com/2017/06/screenshot-from-2017-06-26-14-09-11.png?w=300 300w, https://datawisesite.files.wordpress.com/2017/06/screenshot-from-2017-06-26-14-09-11.png?w=768 768w, https://datawisesite.files.wordpress.com/2017/06/screenshot-from-2017-06-26-14-09-11.png?w=1024 1024w, https://datawisesite.files.wordpress.com/2017/06/screenshot-from-2017-06-26-14-09-11.png 1072w" alt="Screenshot from 2017-06-26 14-09-11.png" data-attachment-id="145" data-permalink="https://datawisesite.wordpress.com/2017/06/26/how-to-embed-tableau-in-jupyter-notebook/screenshot-from-2017-06-26-14-09-11/" data-orig-file="https://datawisesite.files.wordpress.com/2017/06/screenshot-from-2017-06-26-14-09-11.png" data-orig-size="1072,486" data-comments-opened="1" data-image-meta="{"aperture":"0","credit":"","camera":"","caption":"","created_timestamp":"0","copyright":"","focal_length":"0","iso":"0","shutter_speed":"0","title":"","orientation":"0"}" data-image-title="Screenshot from 2017-06-26 14-09-11" data-image-description="" data-image-caption="" data-medium-file="https://datawisesite.files.wordpress.com/2017/06/screenshot-from-2017-06-26-14-09-11.png?w=300" data-large-file="https://datawisesite.files.wordpress.com/2017/06/screenshot-from-2017-06-26-14-09-11.png?w=636">
%%HTML
<div class='tableauPlaceholder' id='viz1474058356757' style='position: relative'><noscript><a href='#'><img alt=' ' src='https://public.tableau.com/static/images/ex/exercice1/Courbesventesetprofit/1_rss.png' style='border: none' /></a></noscript><object class='tableauViz' style='display:none;'><param name='host_url' value='https%3A%2F%2Fpublic.tableau.com%2F' /> <param name='site_root' value='' /><param name='name' value='exercice1/Courbesventesetprofit' /><param name='tabs' value='yes' /><param name='toolbar' value='yes' /><param name='static_image' value='https://public.tableau.com/static/images/ex/exercice1/Courbesventesetprofit/1.png' /> <param name='animate_transition' value='yes' /><param name='display_static_image' value='yes' /><param name='display_spinner' value='yes' /><param name='display_overlay' value='yes' /><param name='display_count' value='yes' /></object></div> <script type='text/javascript'> var divElement = document.getElementById('viz1474058356757'); var vizElement = divElement.getElementsByTagName('object')[0]; vizElement.style.width='100%';vizElement.style.height=(divElement.offsetWidth*0.75)+'px'; var scriptElement = document.createElement('script'); scriptElement.src = 'https://public.tableau.com/javascripts/api/viz_v1.js'; vizElement.parentNode.insertBefore(scriptElement, vizElement); </script>


