I have a field such that
Color
Pink
Blue
Pink
Blue
Pink
Pink
Pink
Pink
Pink
Blue
Blue
Pink
Pink
Pink
Blue
Pink
Blue
Pink
Blue
How to create calculated field to count number of times Pink appears?
Total numbers of Blue?
Trying to count the number of times 1 appears in each column. total each column. examples using WaitingProposal (columns shown in sheet 2)
calculating the number of times waitingProposal shows up in the column data with regards to the filters
waitingProposal = 50 should be?
These are the things I have tried: shown in sheet 3
NumberIds = {FIXED [C Id (Workitem)]:COUNTD([C Id (Workitem)])}
Count Weeks = Window_Count(Count([WaitingProposal]))
NumberIdswp = {FIXED [C Status (Workitem)] : COUNTD([C Status (Workitem)] == 'waitingProposal')}
Sumwp = SUM( INT ( [C Status (Workitem)] = "waitingProposal" ) )
Total = TOTAL(COUNTD([WaitingProposal]))
WaitingProposal = IF ( [C Status (Workitem)] == 'waitingProposal' AND [Max Update] = true ) THEN 1 ELSE 0 END /* used this to mark 1 or 0 for counting
countwp = sum ( [WaitingProposal] )
sumwptotal = Total(SUM ( INT ( [C Status (Workitem)] = "waitingProposal" ) ))
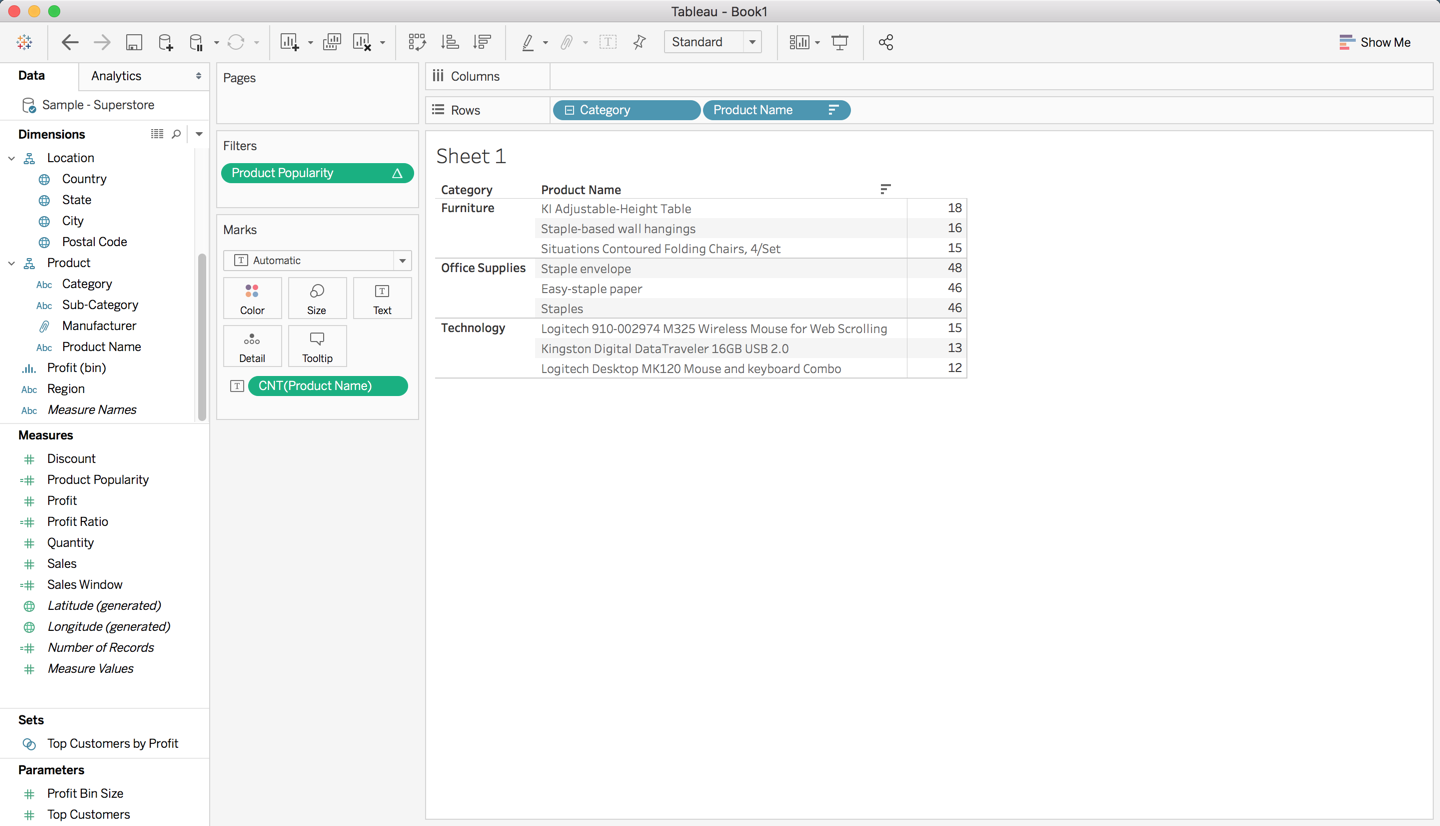
Tableau's Sample Superstore dataset can be used to walk through one way you can show the top N number of Products by Category. This example will easily transfer to Dog Names by Neighborhood.
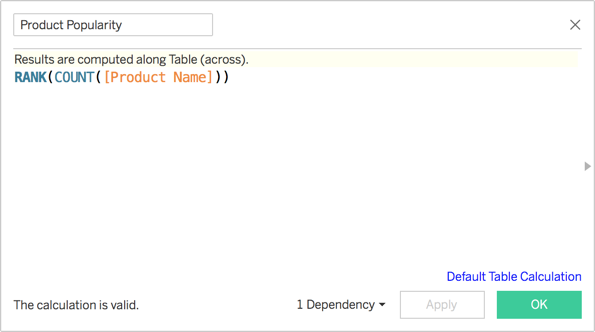
Create a Tableau calculation and use as a filter later.
RANK(COUNT([Product Name]))
And then put the Category and Product Names dimension on the Rows shelf and the Count of Product Names on the Text marks card.
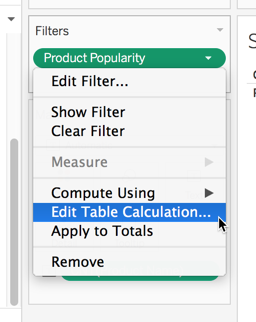
Now, place the Production Popularity table calculation on the filter shelf.
When the dialog box appears, just click OK.
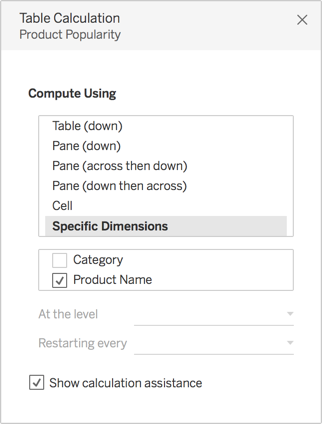
Edit accordingly how our Table calculation runs to get the Top N Product Names within each Category.
Now, Select Specific dimension and then uncheck Category or Neighborhood in your case.
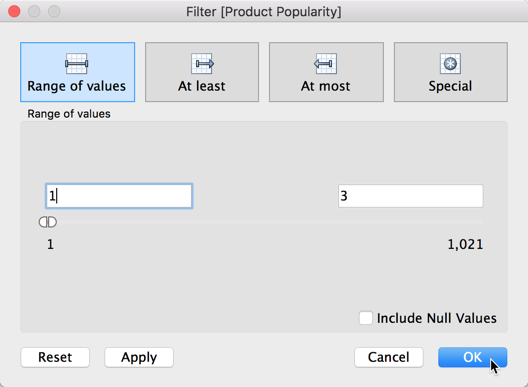
Now we need to go edit our filter.
For this example,Set the upper limit to 3.
Click OK and then you must be able to see the top 3 Product Names by Category.
{ FIXED : SUM([Number of Records]) }
1{ FIXED : SUM(1) }