QBoard » Advanced Visualizations » Viz - Tableau » Redaction in Tableau

Redaction in Tableau

  • I am currently in the process of building some Tableau workbooks where we will need to redact visualizations or text tables if the results fall below a certain threshold (e.g. only ten data points are returned after filters are applied). Does anyone know how to create calculated fields or know of other methods to redact in Tableau?

     
      November 17, 2021 1:13 PM IST
    0
  • To redact data at rest, use the built-in functions in:

    To redact data in motion (dynamic data masking), use the replace_char API function in the FieldShield SDK

    In each case, you can use the IRI product you need to search for, classify, and redact a specified number of bytes, defined (sub-)strings, entire fields, or one or more rows. Choose the type and start/stop locations of the masking characters. Determine whether to apply the redaction based on column names or data classes, pattern matches, field value conditions, NER models, etc.

    Character masking is just one of the non-reversible protection functions provided in IRI software. Others include randomization, external source pseudonymization, and possibly hashing. Reversible protections include encryption, encoding, a proprietary ASCII de-ID function, same-source pseudonymization, expression logic, and string functions.

    Workbench redact

    SortCL users have the additional option to transform and report on data as they redact it in whole or part.

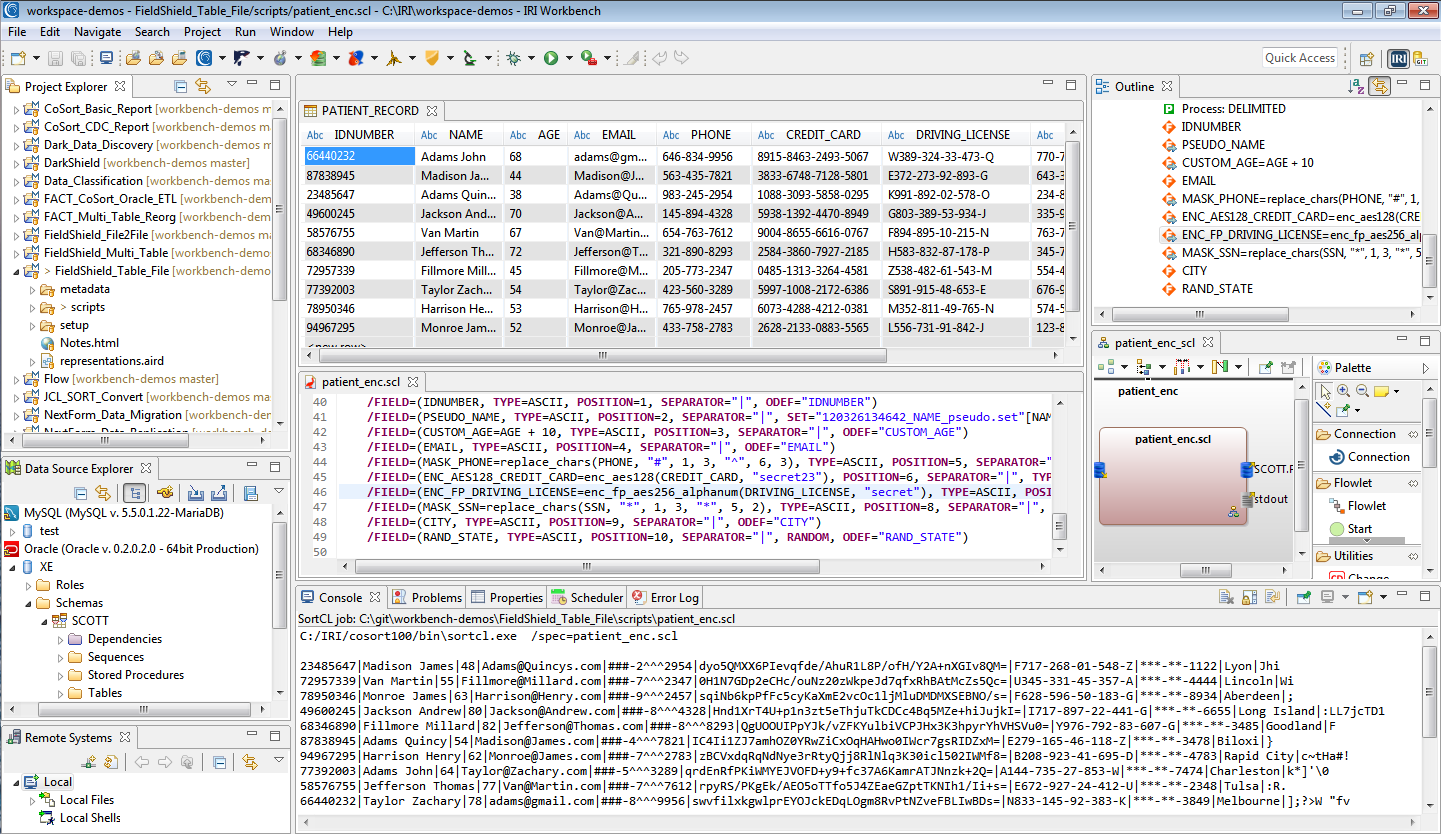
    All IRI software is supported in a free, familiar GUI built on Eclipse called IRI Workbench, which exposes and profiles multiple data sources, helps configure masking jobs, and manages the projects for team-sharing and compliance verification.

      December 3, 2021 12:39 PM IST
    0
  • I found a partial solution on the Tableau community forum/knowledgebase about redaction that might work for other implementations.

    The basic idea is to create two different calculated fields, one which displays a integer value and the other that displays a string value. That way, when both are concatenated in the display you get the desired output without breaking any of the calculated field rules.

    So create a calculated field that has a formula like:

    IF sum([Datafield_to_Redact]) < 10 THEN "*" ELSE str(sum([Datafield_to_Redact])) END


    And another that has a calculated field that has a formula like:

    IF sum([Datafield_to_Redact]) < 10 THEN null ELSE sum([Datafield_to_Redact]) END


    In the post the attached workbook and screenshot show how the two values are concatenated in the Text mark.

      November 18, 2021 11:55 AM IST
    0
  • You can create a threshold filter that compares the number of filtered responses to a threshold value set in a parameter.

    First, create a parameter with integer data type and set it to the desired threshold. In this example, I called it Count Threshold.

    Then create a calculated field for the filter with an equation like the following:

    {FIXED: COUNTD([Respondent ID]) >= [Count Threshold]}


    (I did this for survey results where we needed to hide results if the filtered number of respondents was fewer than 10.)

    For the threshold filter to be applied after your other filters, choose "Add to Context" for your other filters.

      November 23, 2021 12:57 PM IST
    0